A Beginner's Guide to UK Postcodes for Geospatial Analysis
October 09, 2026 - Geodata

October 09, 2026 - Geodata
October 05, 2026 - Maps

October 04, 2026 - Tutorials

September 30, 2026 - Technology
Picking the wrong satellite image derails more geospatial projects than bad code or a shaky coordinate system. A 10-metre Sentinel-2 scene will never show you individual parked cars, and a 30-centimetre commercial image will not give you a weekly record of the same field for five years. Neither is a failing of the data. Both are the predictable result of how the sensor was built. Knowing the four resolutions — spatial, spectral, temporal and radiometric — turns imagery selection from guesswork into a short, defensible decision.
Resolution is not one number. Every sensor is a bundle of compromises, and the four types pull against each other.
Turn one dial up and another usually moves down. That is the whole game.
Sentinel-2 illustrates the split neatly. Its visible and near-infrared bands arrive at 10 m, its red-edge and shortwave bands at 20 m, and its atmospheric bands at 60 m — all from the same overpass. Landsat's optical bands sit at 30 m. Commercial high-resolution satellites reach roughly 30–50 cm in panchromatic and around 1–2 m in multispectral.
Ground sample distance is pixel spacing, not the smallest object you can identify. In practice a feature needs to span several pixels before you can map it reliably. A hedgerow one pixel wide appears as a faint smudge and disappears entirely after resampling or reprojection.
Two habits save time here. First, treat pan-sharpening with care: it blends high-resolution panchromatic detail with colour, which looks impressive but invents detail at the finest scale. Never measure area from a sharpened image. Second, remember that a 10 m pixel over a field boundary averages crop and track together, so mixed pixels are a permanent feature of coarse data — plan your classification around them rather than hoping they go away.
A panchromatic sensor records one broad band stretching across the visible and near-infrared. A multispectral sensor divides that range into a handful of bands. Sentinel-2 carries 13; Landsat 8 and 9 carry 11 across optical and thermal. Hyperspectral instruments go much further, with hundreds of narrow, contiguous bands.
Band placement often matters more than band count. The red edge sits where chlorophyll reflectance shifts, which is why it separates stressed vegetation from healthy growth long before the difference is visible to the eye. Shortwave infrared responds to moisture in soil and foliage. Thermal bands record emitted heat, useful for urban surfaces and water temperature. If your question depends on one of these, check the sensor has a band in the right place before anything else.
There is a physical reason narrow bands rarely come with fine pixels: splitting incoming light more finely leaves less energy per band, so the instrument compensates with a larger pixel or a lower signal-to-noise ratio. That is exactly why Sentinel-2's 60 m bands exist alongside its 10 m ones.
Revisit time sounds simple until you account for constellations. Sentinel-2 nominally revisits every five days with two operational satellites. Landsat runs a 16-day cycle. PlanetScope's fleet images much of the land surface daily. MODIS manages twice a day, at 250 m to 1 km.
Nominal revisit is best case. Off-nadir pointing can shorten the gap between passes, but it stretches pixels, shifts shadows and changes the viewing geometry, which complicates change detection. Cloud is the harder constraint. Across the UK and Ireland, optical imagery in winter can be unusable for weeks, and a five-day sensor might give you a handful of genuinely clear scenes in a season. If you need regular, cloud-independent observation, radar such as Sentinel-1 works through cloud and darkness and pairs well with optical data for the same area.
Radiometric resolution is the number of brightness levels available per pixel. Eight-bit data gives 256 levels, 12-bit gives 4,096, 16-bit gives 65,536. Sensors rarely use that full range, so the effective difference is usually smaller than the numbers suggest — but it still matters.
More levels mean smoother gradients. That is valuable when you are hunting subtle change: suspended sediment in a river, a slight shift in vegetation vigour, the soft edge of a cloud shadow. Too few levels shows up as banding, and posterised water surfaces that no classifier can separate properly.
This is also the resolution most often thrown away in processing. Stretching an 8-bit JPEG exported for a map is no basis for analysis. Work from the delivered bit depth, keep the original files, and let statistical packages use the full range.
Aperture, orbit and downlink capacity set hard limits. Finer pixels mean a narrower swath and less area captured per pass. More bands mean less energy per band. Daily revisit means a constellation rather than one satellite, and commercial archives carry licensing and minimum-order conditions worth checking early.
None of this makes one sensor better than another. It makes them suited to different questions.
The last step is the one people skip. Order one scene, run the analysis you intend to run, and look at the result. If two sensors both seem plausible, process the same site with both and compare — the ambiguity usually resolves itself within an afternoon. Resolution is a design choice, not a ranking, and the right answer is the one that answers your question without costing you three weeks of cleaning up data you did not need.
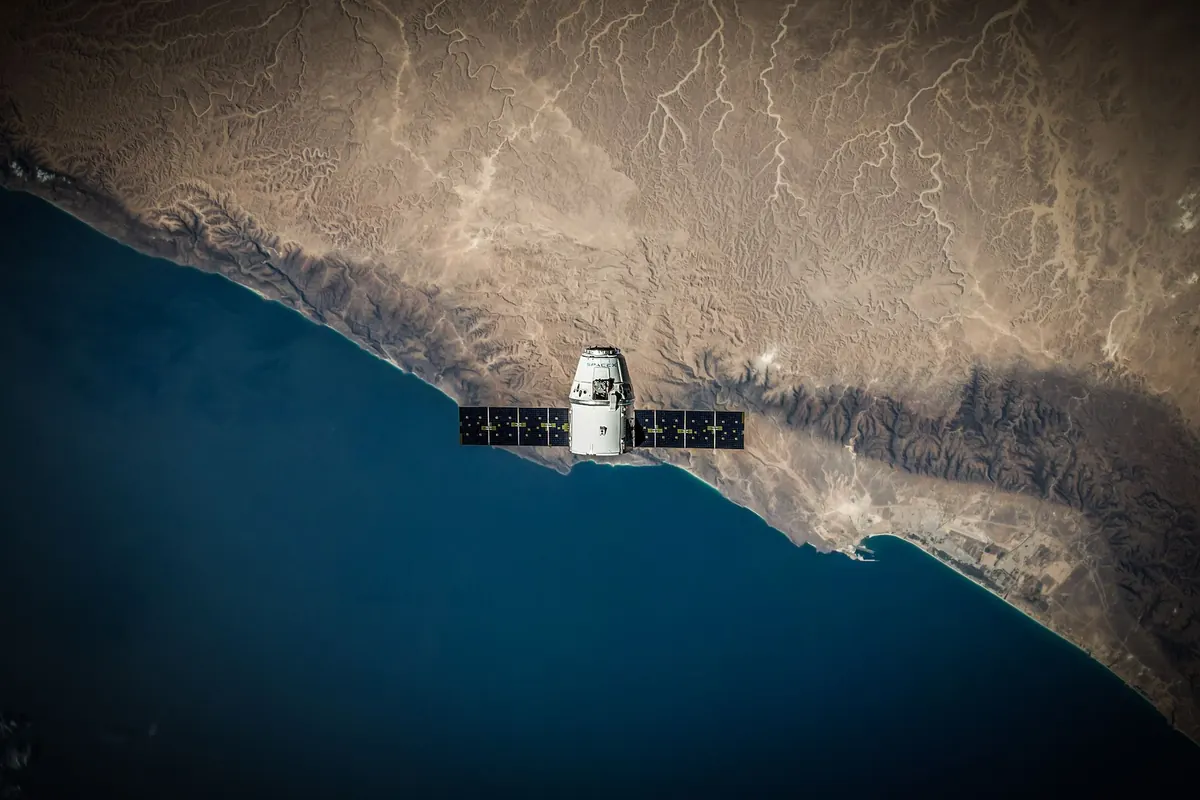
Photo: SpaceX / Pexels
A practical introduction to UK postcode structure, geocoding options and aggregation choices for mapping location...
A practical guide to England and Wales' definitive maps, CRoW access land and the open data sources you can use to...
October 09, 2026 - Geodata
October 05, 2026 - Maps
October 04, 2026 - Tutorials
Copyright © 2026 Atlas Bit. All Right Reserved.